|
> with(plots); [animate, animate3d, conformal, contourplot, cylinderplot, densityplot, display, display3d, fieldplot, fieldplot3d, gradplot, gradplot3d, implicitplot, implicitplot3d, loglogplot, logplot, matrixplot, odeplot, pointplot, polarplot, polygonplot, polygonplot3d, polyhedraplot, replot, setoptions, setoptions3d, spacecurve, sparsematrixplot, sphereplot, surfdata, textplot, textplot3d, tubeplot] > eq1 := x^3 + y^3 + z^3 + 3 = (x + y + z + 1)^2; > xyzrange := x = -2..2, y = -2..2, z = -2..2; > implicitplot3d(eq1, xyzrange, grid = [13,13,13]); 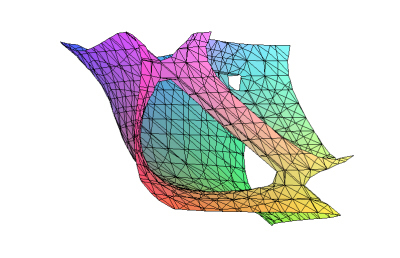 > eq2 := x^2 + y^3 + z^4 + 3 = (x + y + z + 1)^2; > xyzrange := x = -2..2, y = -2..2, z = -2..2; > implicitplot3d(eq2, xyzrange, grid = [13,13,13]); 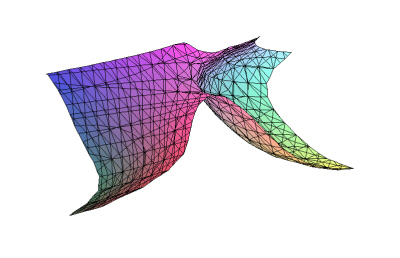 > eq3 := x^3 + y^2 + z^3 + 3 = (x + y + z + 1)^2; > xyzrange := x = -2..2, y = -2..2, z = -2..2; > implicitplot3d(eq3, xyzrange, grid = [13,13,13]); 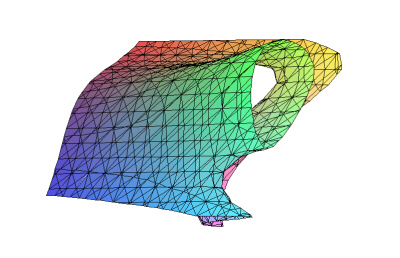 |