> plot(x*sin(x),x);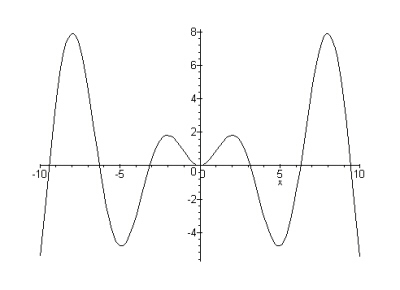 > plot(x*sin(x),x=-5..5,y=-6..2); 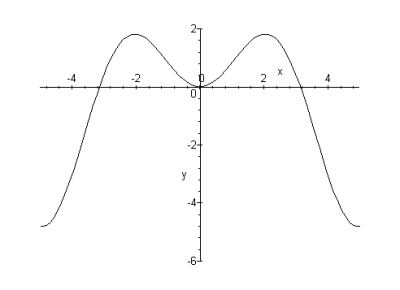 |
|
> plot(x*sin(x),x); > plot(x*sin(x),x=-5..5,y=-6..2); |
|
> # Un exemple de courbe paramétrique. > plot([(t*cos(t))^2,t*sin(t^2),t=-2*Pi..2*Pi]); 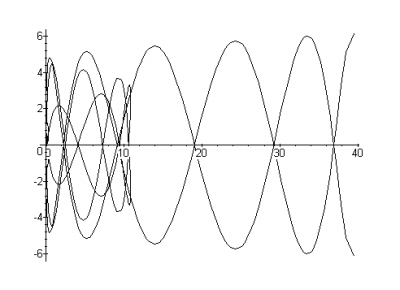 > plot([(t*cos(t))^2,t*sin(t^2),t=-2*Pi..2*Pi],coords=polar); 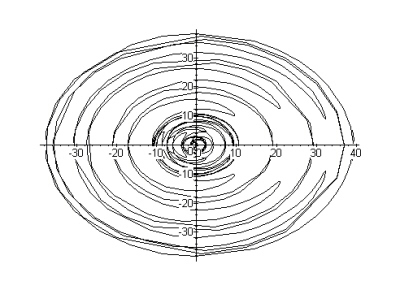 |
|
> # Exemple de présentation des graphiques. > with(plots); [animate, animate3d, conformal, contourplot, cylinderplot, densityplot, display, display3d, fieldplot, fieldplot3d, gradplot, gradplot3d, implicitplot, implicitplot3d, loglogplot, logplot, matrixplot, odeplot, pointplot, polarplot, polygonplot, polygonplot3d, polyhedraplot, replot, setoptions, setoptions3d, spacecurve, sparsematrixplot, sphereplot, surfdata, textplot, textplot3d, tubeplot] > xscale := x = -2*Pi..2*Pi; > courbe2 := plot(cos(x),xscale,color=red): > titre := title = `sin(x) (mince, rouge), cos(x) (gras, bleu)`; > titrefont := titlefont = [TIMES,BOLD,12]; > display({courbe1,courbe2},titre,titrefont); 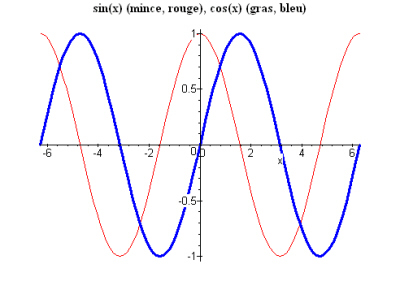 |